Methods and Pipeline
SIDISH-based multi-omics risk modeling
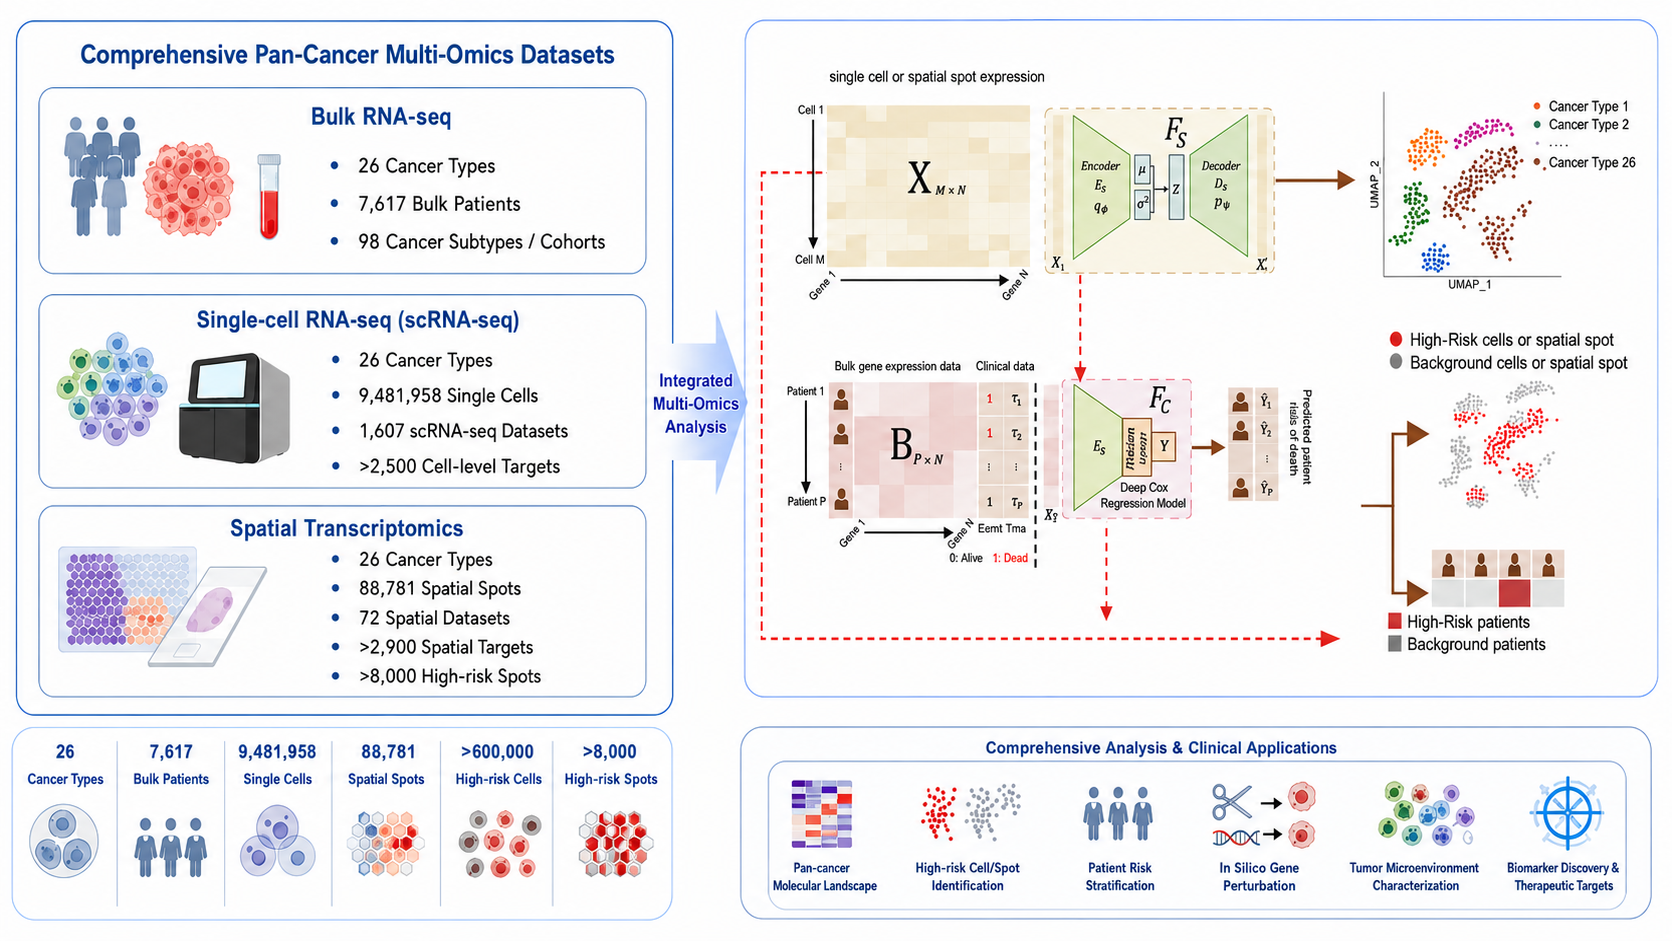
The current SpatioCellularRisk workflow uses SIDISH to connect patient-level prognosis with cell- and spot-level molecular states across bulk RNA-seq, single-cell RNA-seq and spatial transcriptomics. SIDISH was introduced as a framework that integrates single-cell and bulk transcriptomics to identify high-risk cells and guide precision therapeutics through in silico perturbation [1]. SpatioCellularRisk extends this logic across bulk, single-cell and spatial modules so that each cell or spot can receive a continuous risk score and a categorical high-risk or background label.
The data layer integrates database resources from TCGA, GEO, ICGC, CancerSCEM and SORC, covering patient-level bulk cohorts, public transcriptomic studies, cancer genome projects, single-cell cancer expression maps and spatial omics cancer resources [2-6]. At the patient layer, survival-associated risk is modeled through a Cox-based prognostic component inspired by deep Cox survival modeling, which is designed to learn nonlinear associations between molecular covariates and time-to-event outcomes [7].
Downstream biological interpretation uses established analysis tools around the SIDISH outputs. DESeq2 supports differential expression for high-risk versus background or tumor-normal comparisons [8], GO enrichment is summarized through clusterProfiler functional annotation [9], ESTIMATE immune and stromal scoring describes bulk tumor microenvironment context [10], TIDE immune dysfunction and exclusion scoring supports immunotherapy-response interpretation [11], CellPhoneDB supports ligand-receptor communication analysis in high-risk cellular states [12], and Scanpy/AnnData data structures support scalable single-cell and spatial matrix handling [13].
Documentation
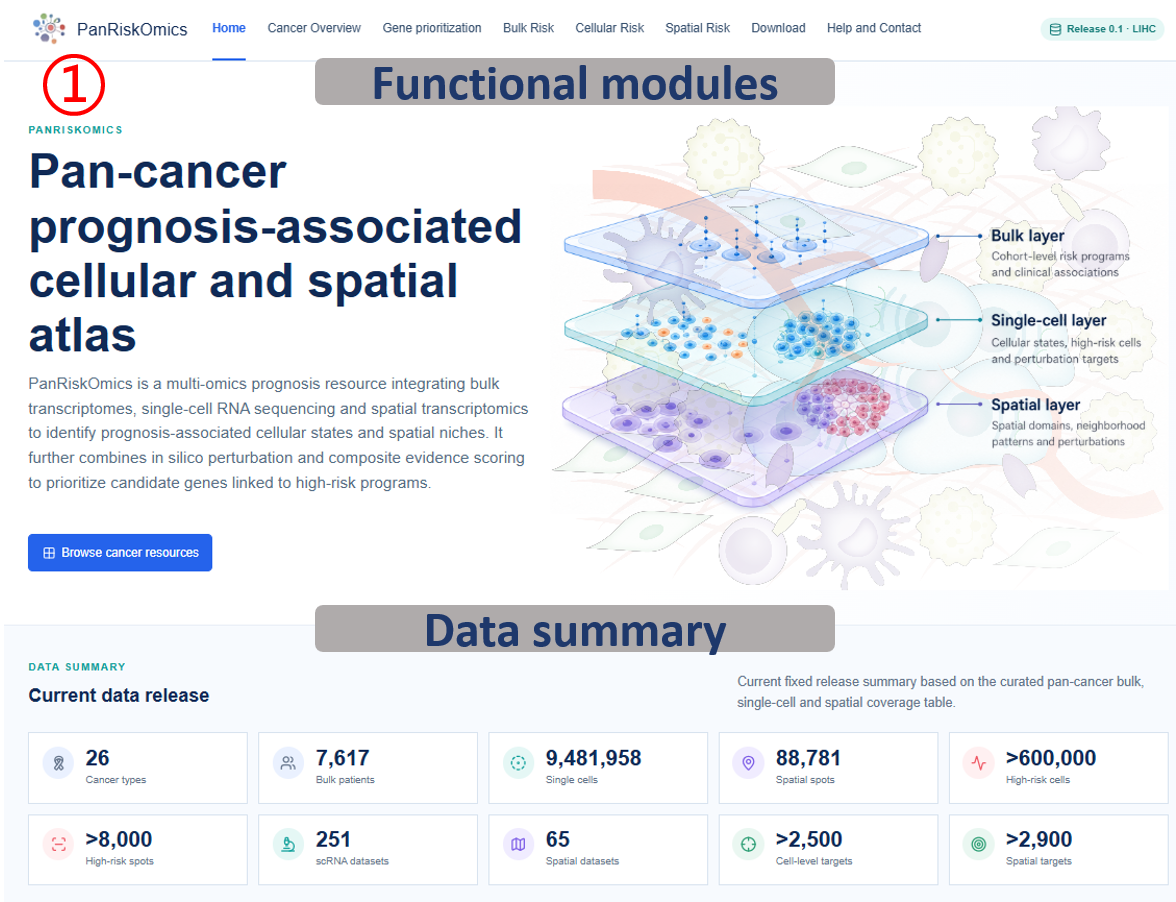
SpatioCellularRisk integrates bulk transcriptomes, single-cell RNA sequencing and spatial transcriptomics to identify prognosis-associated cellular states, spatial niches and candidate genes. Each module reads standardized SOP outputs and exposes tables, figures and gene-level evidence for downstream exploration. The web resource is implemented as a FastAPI/Jinja application with Plotly-based interactive visualization, curated static PDF/PNG previews, controlled file-download manifests and a JSON-to-SQLite runtime catalog so that the same analysis outputs can be browsed consistently across Home, Cancer Overview, Gene prioritization, Gene Detail, Bulk Risk Analysis, Single-cell Risk Analysis, Spatial Risk Analysis and Download Center.
The documentation below follows the same module order as the site navigation. Each module first shows the corresponding tutorial images in reading order, then explains the gray callout regions from the images in paragraph form. When a screenshot contains a data table, the relevant table headers are explained separately so that users can map visible columns to biological meaning and downstream use.
Home
Annotated guide
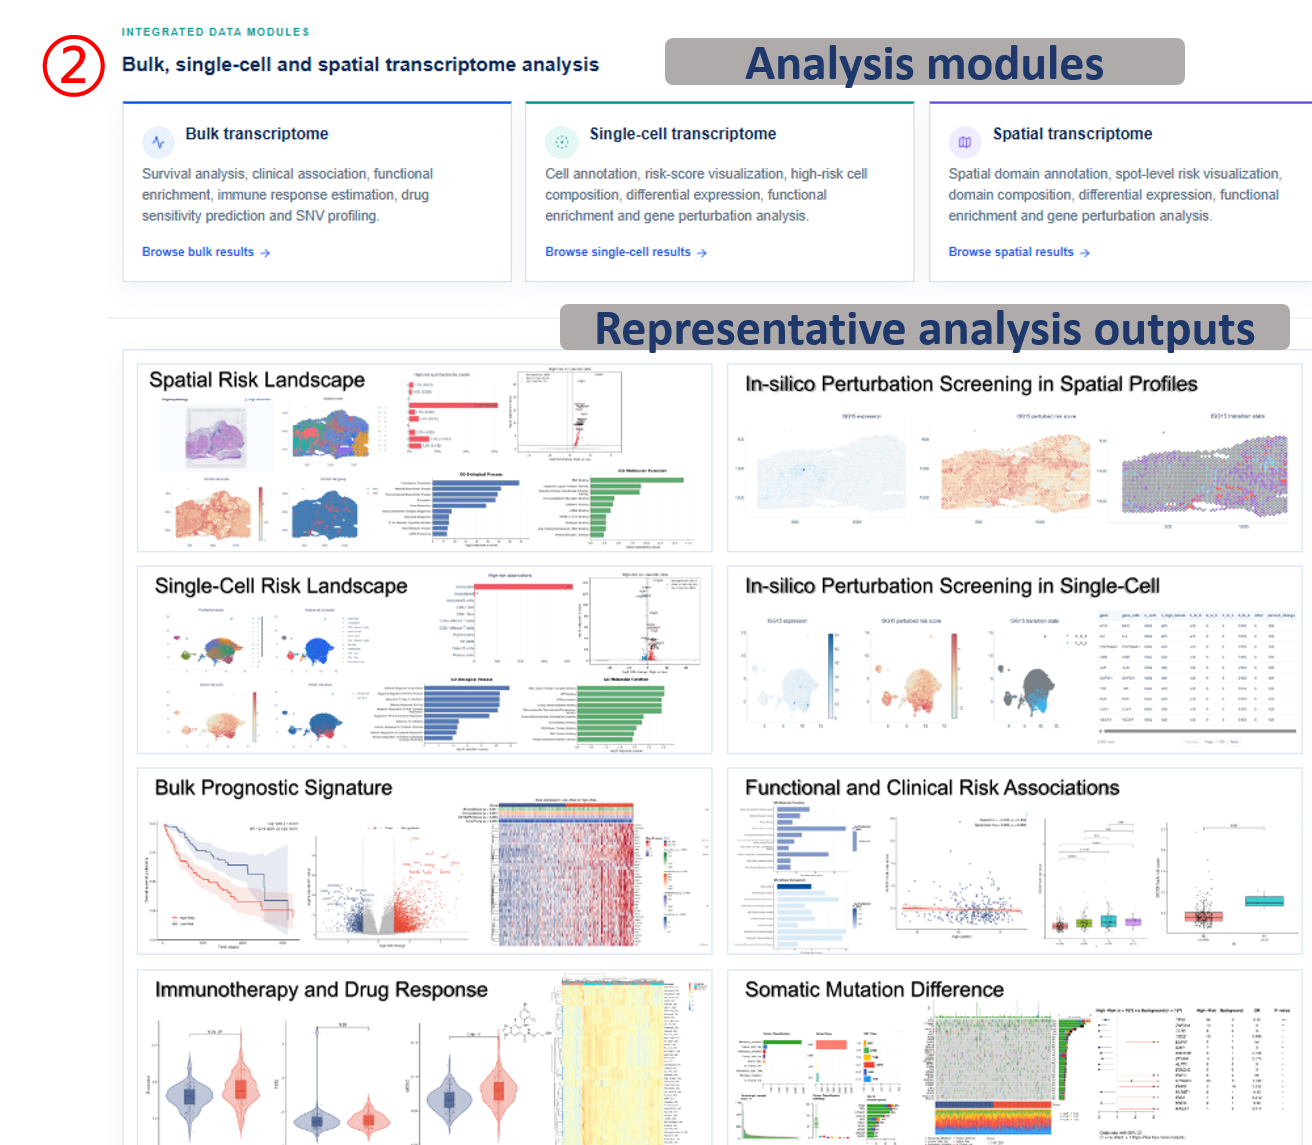
Navigation bar switches between cancer coverage, gene prioritization, bulk, single-cell, spatial, download and help modules. Data summary reports the fixed release scale, including cancer types, patients, cells, spots and perturbation targets. Module cards provide direct entry points to the three analysis layers: bulk transcriptome, single-cell transcriptome and spatial transcriptome. Organ atlas links anatomical regions to cancer-specific resource pages and downstream module buttons.
How to use this page
Start from the data summary to understand the release scale before selecting a module. Use the module cards when you already know the analysis layer you need, and use the organ atlas when you want to start from a cancer type or tissue context. The downstream buttons move from a cancer overview to gene prioritization, bulk, single-cell or spatial evidence.
Cancer Overview
Annotated guide
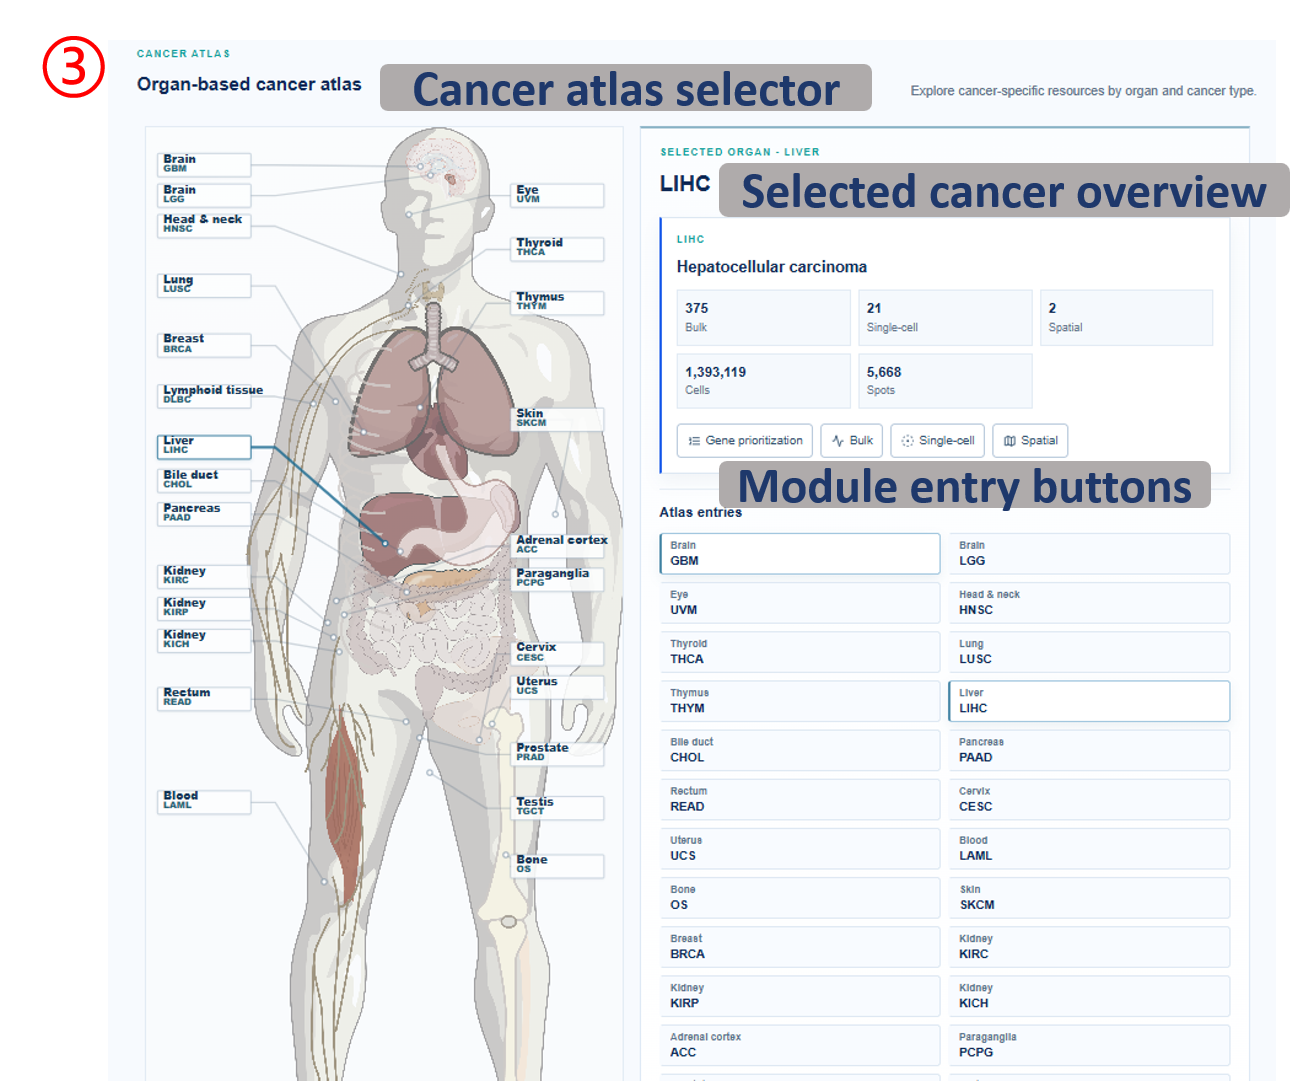
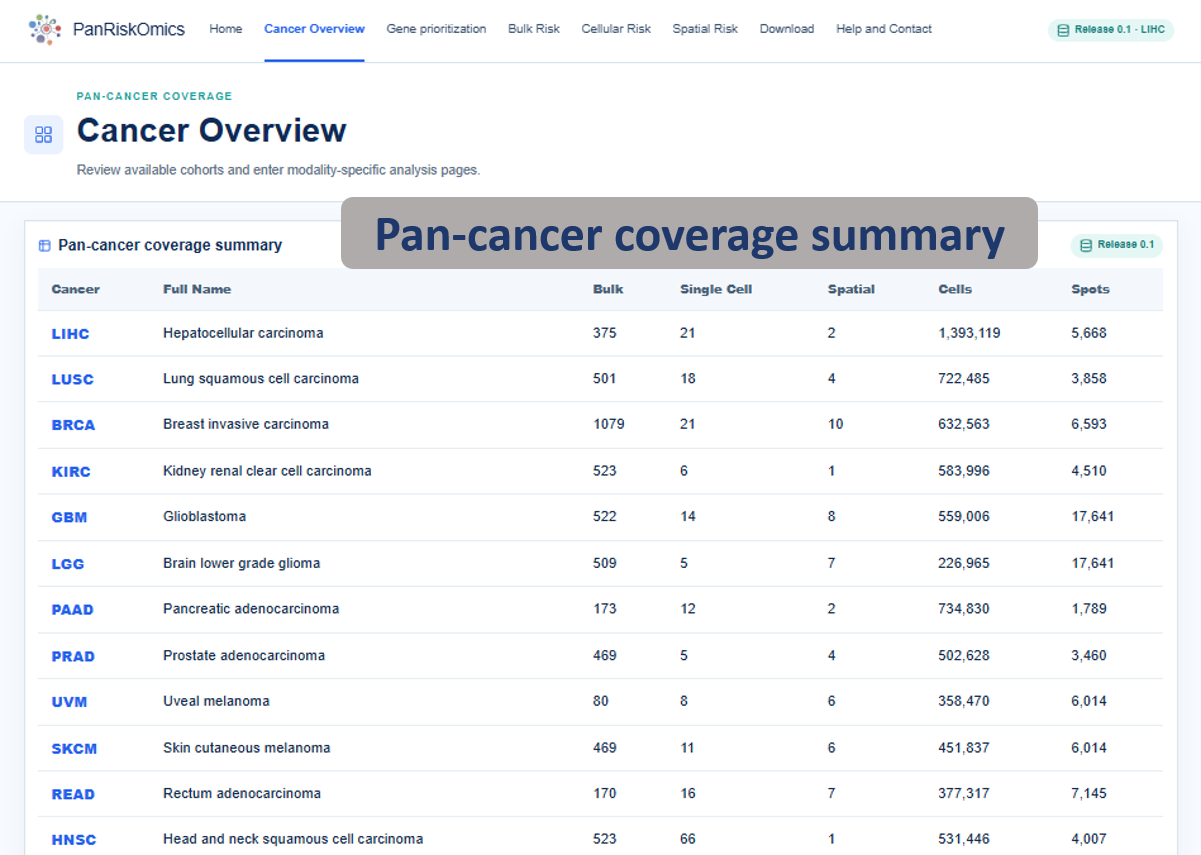
Coverage summary lists available cancer resources and the scale of each omics layer. Organ-based atlas highlights cancer entries by anatomical location and exposes module-level action buttons. CSV export downloads the visible coverage table for local record keeping or downstream reporting.
Table columns
- Cancer: TCGA cancer abbreviation used for navigation and filtering.
- Full name: expanded cancer name shown for readability.
- Bulk: number of bulk patients or samples represented in the release table.
- Single-cell: number of single-cell datasets or samples indexed for that cancer.
- Spatial: number of spatial datasets or samples indexed for that cancer.
- Cells / Spots: total single-cell observations and spatial spots available for exploration.
Gene prioritization
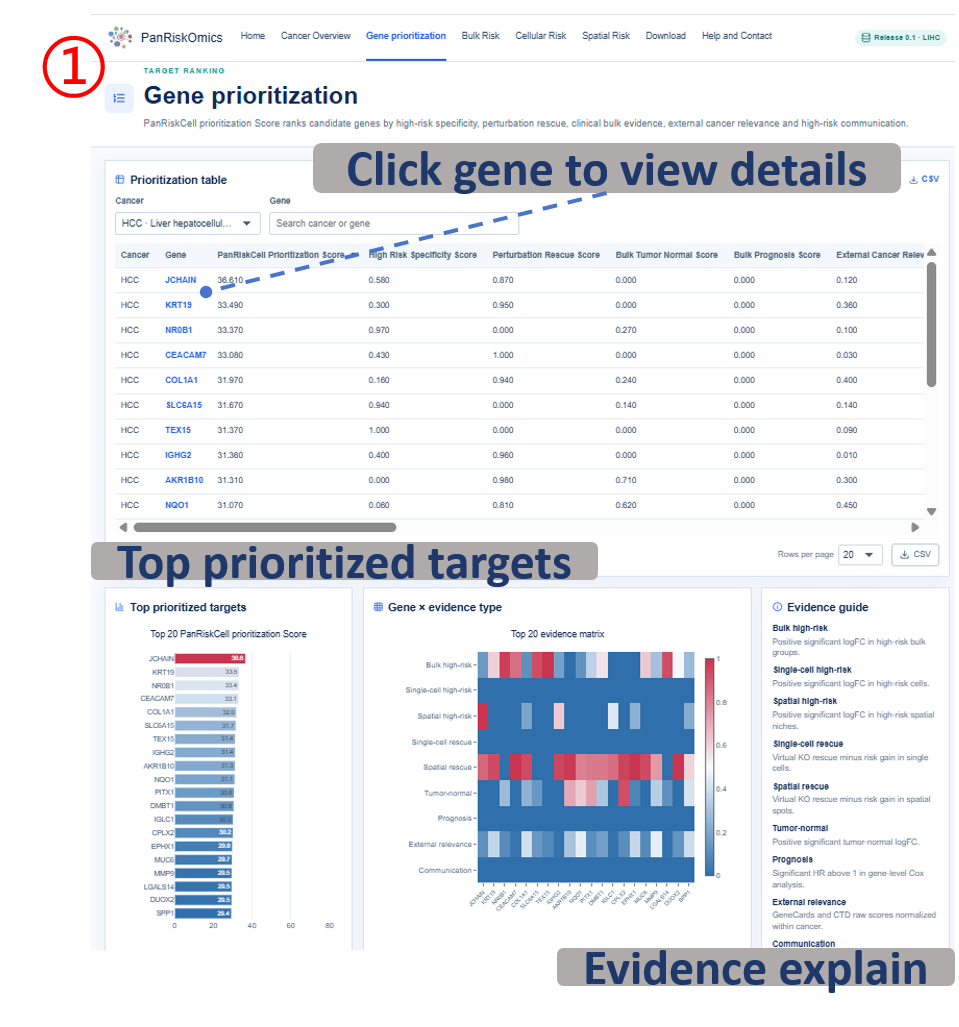
The score rescales six normalized evidence components to a 0-100 ranking. Larger values indicate genes with stronger combined evidence for high-risk specificity, perturbation rescue, tumor-normal dysregulation, patient prognosis, external cancer relevance and high-risk cell communication.
In this formula, SPRC is the final PanRiskCell prioritization Score; H represents high-risk specificity across bulk, single-cell and spatial evidence; R represents in silico perturbation rescue evidence, especially high-risk to background transitions; T represents tumor-normal expression evidence; P represents bulk prognosis evidence; E represents external cancer relevance; and C represents high-risk communication evidence from ligand-receptor analysis.
Annotated guide
Cancer selector switches the prioritization table and plots to the selected cancer context. Candidate table ranks genes by the final PanRiskCell prioritization Score and allows search or sorting. Top target plot summarizes the highest-ranked candidate genes for quick screening. Evidence heatmap decomposes the final score into interpretable evidence tracks, and Evidence guide explains how each evidence track contributes to the candidate-gene ranking.
Table columns
- gene: candidate gene symbol; selecting it opens the gene detail page.
- panriskcell_prioritization_score: weighted final score computed from the six evidence components.
- bulk_high_risk_score / single_cell_high_risk_score / spatial_high_risk_score: risk-specific evidence in patient, cell and spot layers.
- single_cell_perturbation_score / spatial_perturbation_score: predicted rescue evidence after in silico perturbation.
- bulk_tumor_normal_score: tumor-versus-normal expression evidence.
- bulk_prognosis_score: patient-level prognosis association evidence.
- external_cancer_relevance_score: support from external cancer-relevance resources.
- communication_score: ligand-receptor communication evidence linked to high-risk cells.
Gene Detail
Annotated guide
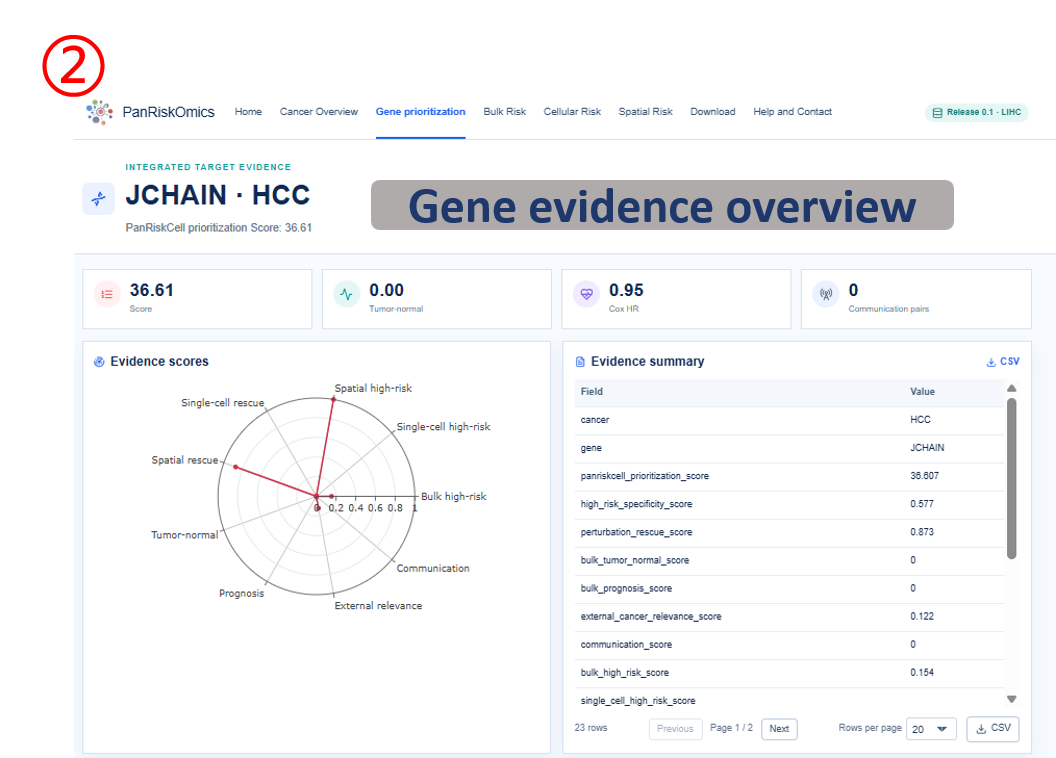
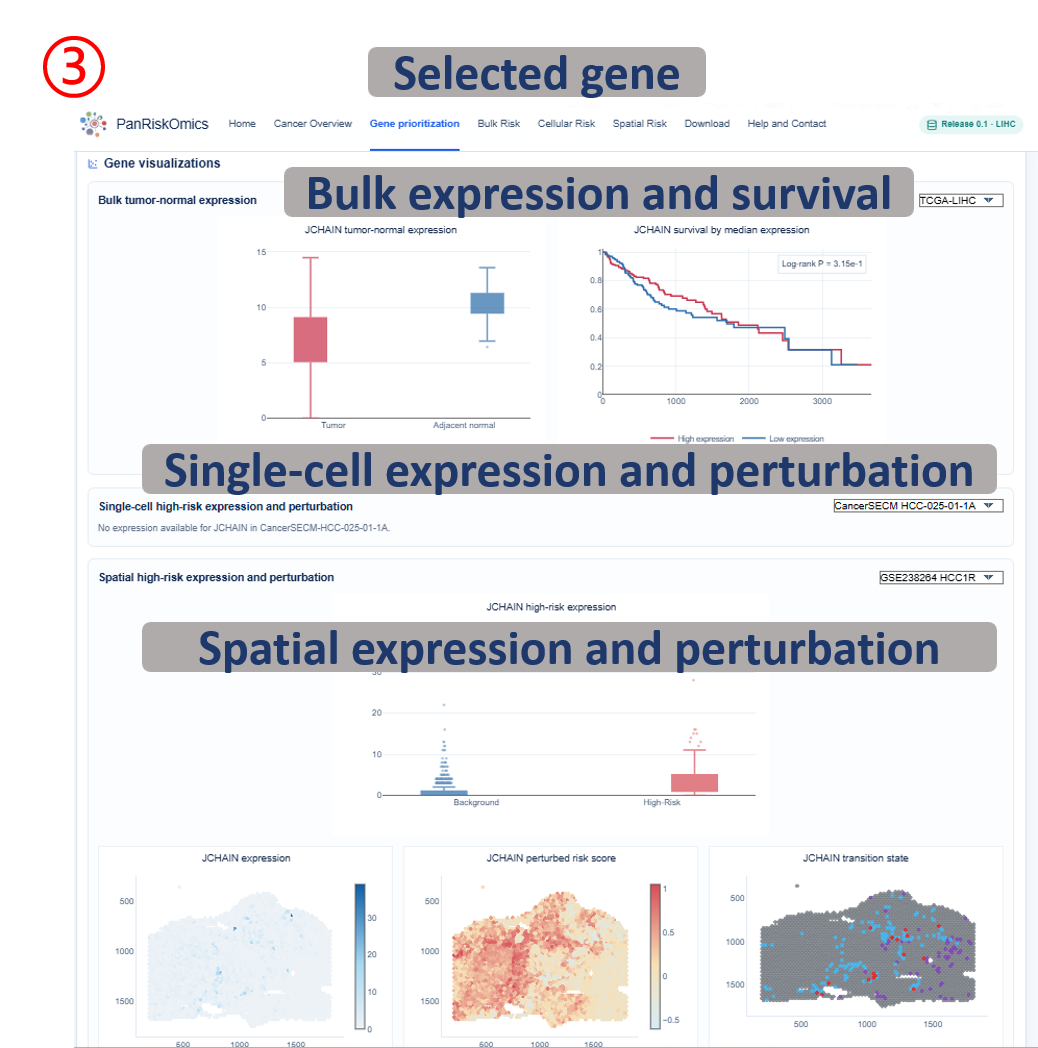
Gene header confirms the selected cancer and candidate gene being inspected. Evidence radar shows how the gene performs across prioritization evidence categories. Evidence records list the numerical evidence behind the ranking rather than only the final score. Bulk panels connect gene expression with tumor-normal expression and patient survival evidence, while Single-cell and spatial panels show expression, perturbed risk score and transition state in the corresponding coordinate system.
Result fields
- score fields: normalized evidence values used to compare genes within the selected cancer.
- expression: observed gene expression on UMAP or spatial tissue coordinates.
- perturbed_score: predicted risk score after in silico perturbation of the selected gene.
- transition: predicted state change category, such as high-risk to background or background to high-risk.
- survival statistics: hazard ratio, confidence interval and P value describing patient-level prognostic association.
Bulk Risk Analysis
Annotated guide
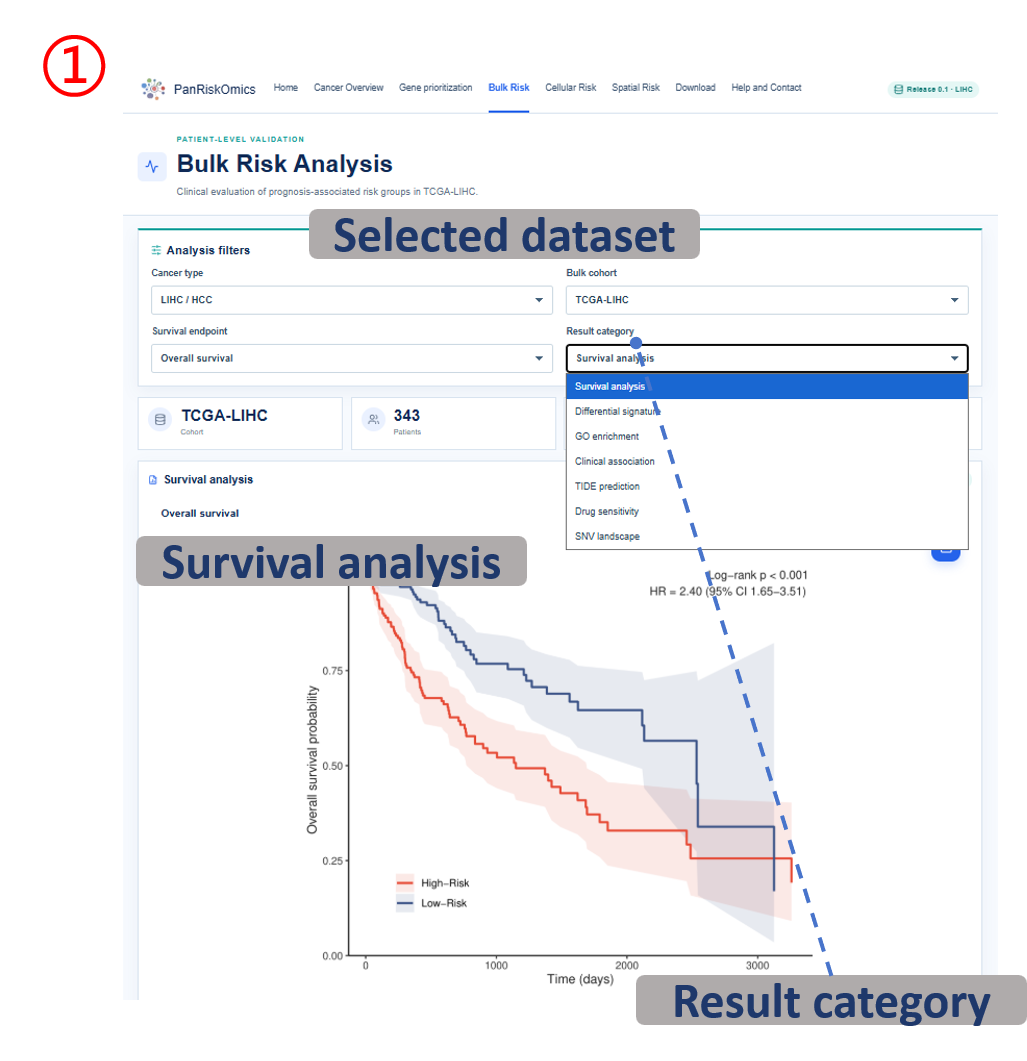
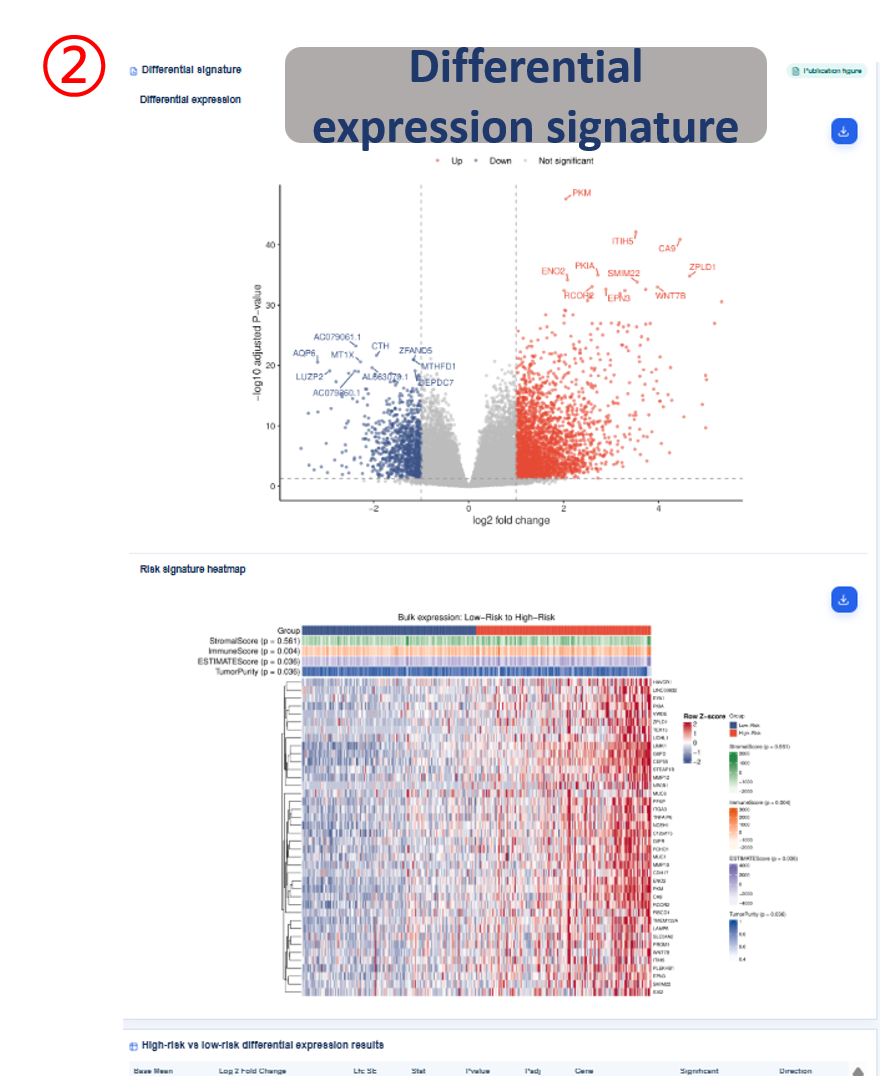
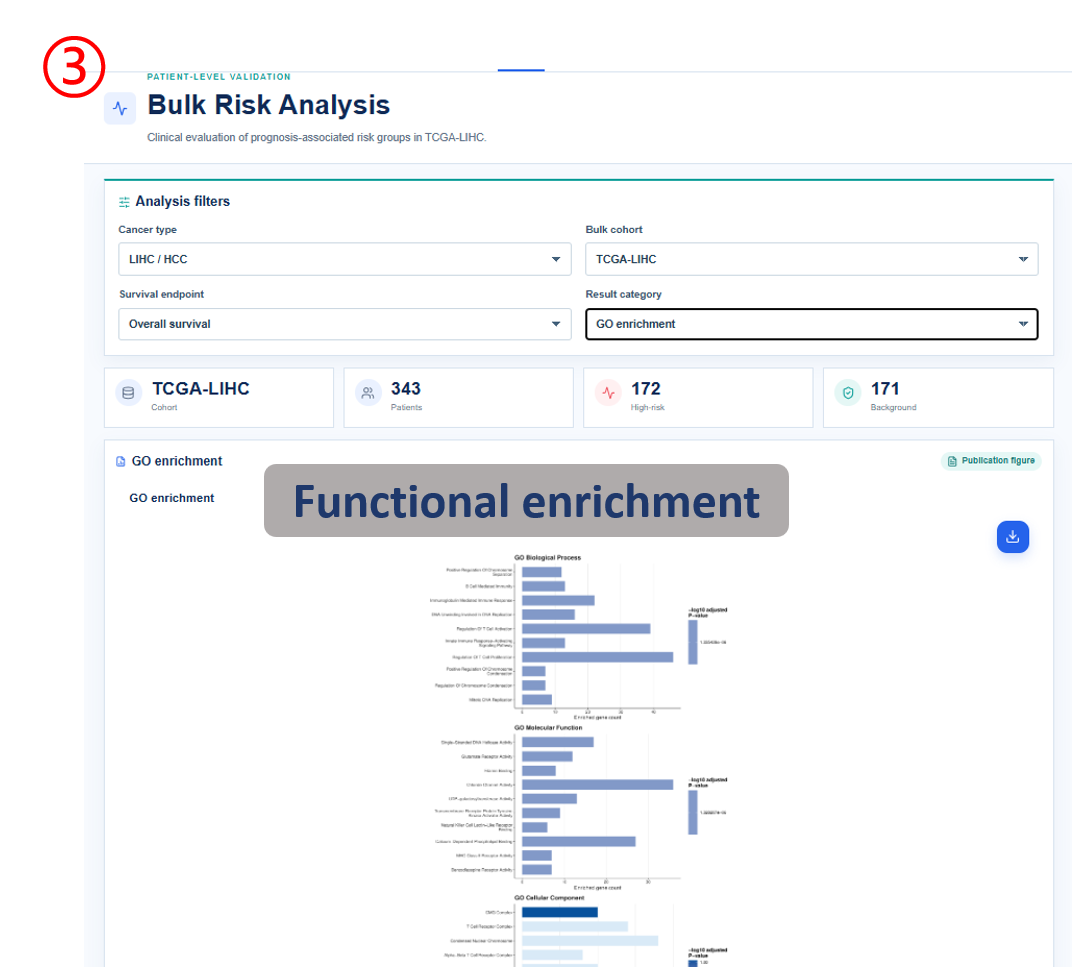
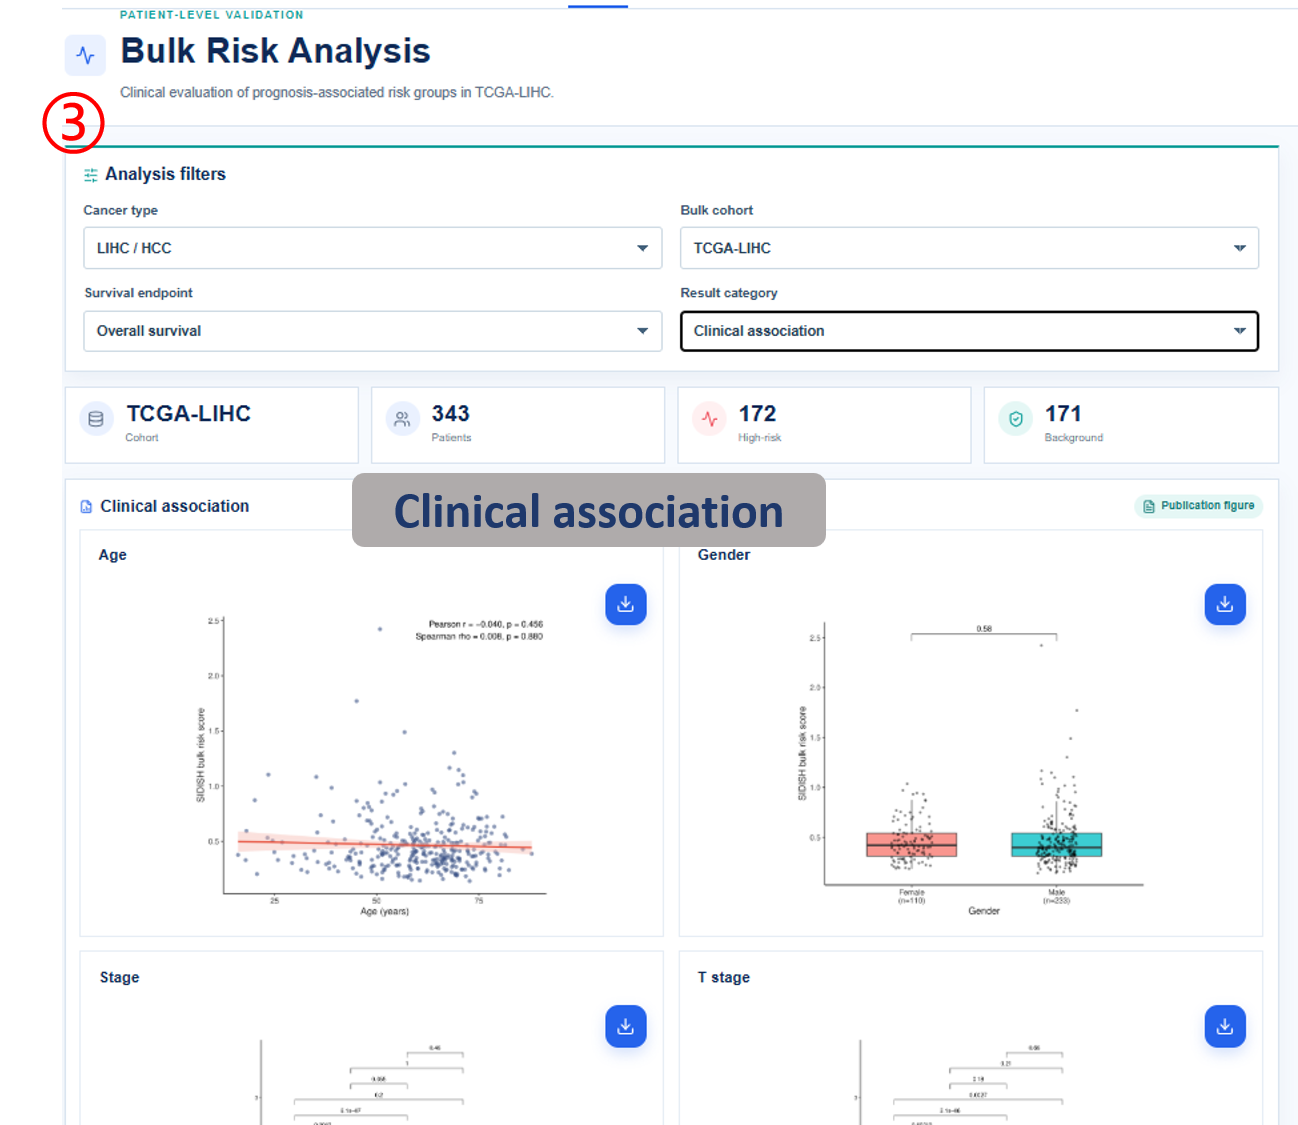
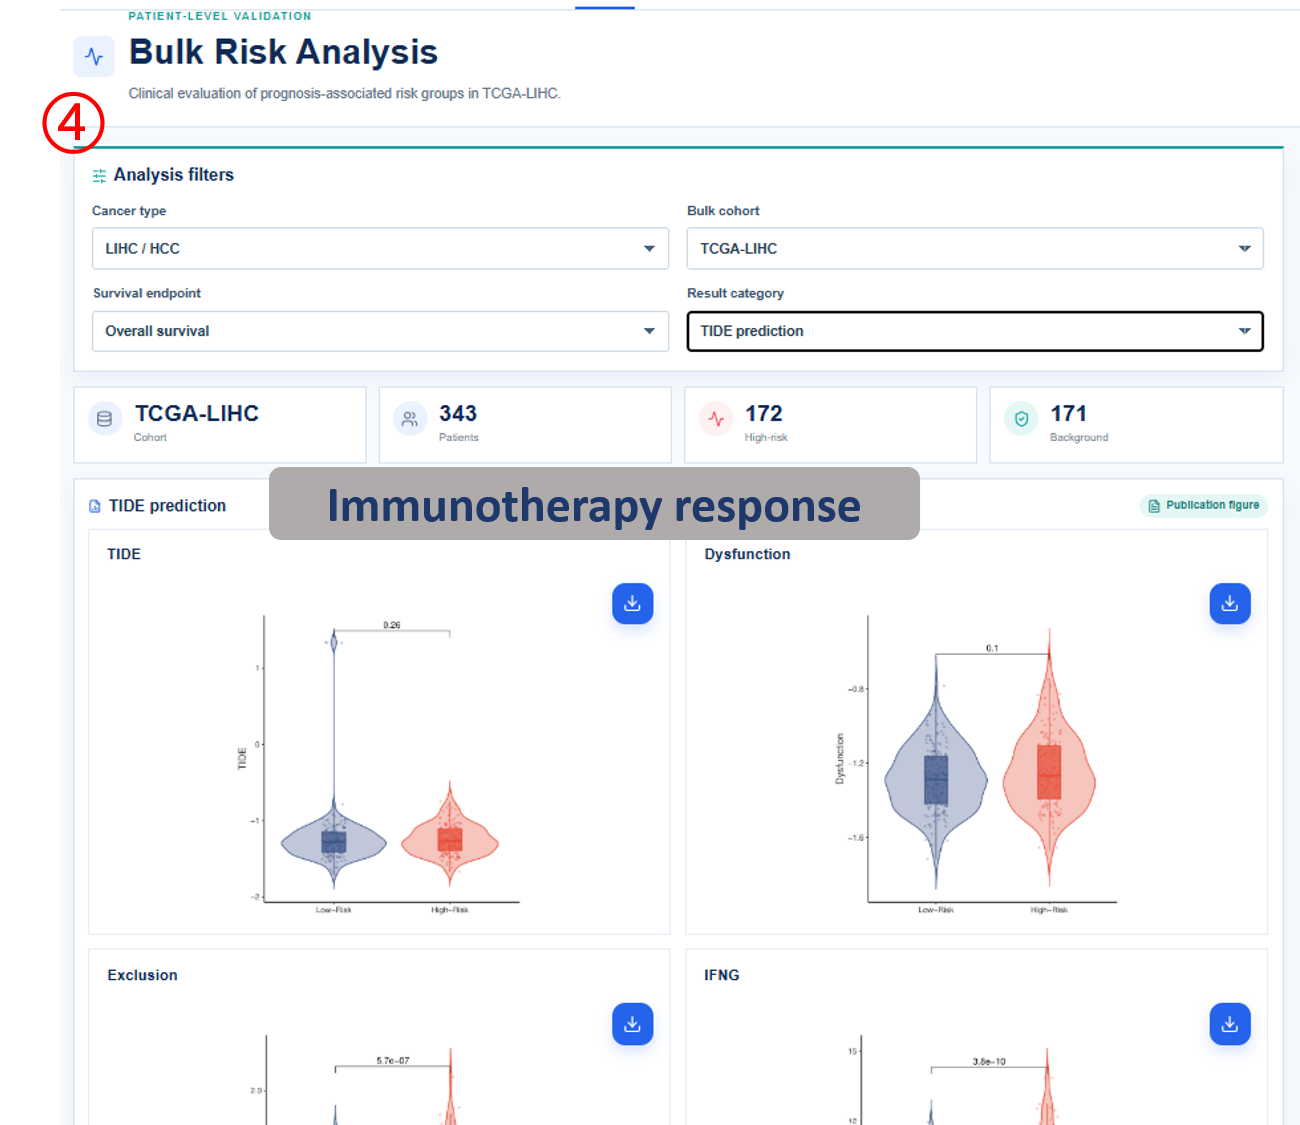
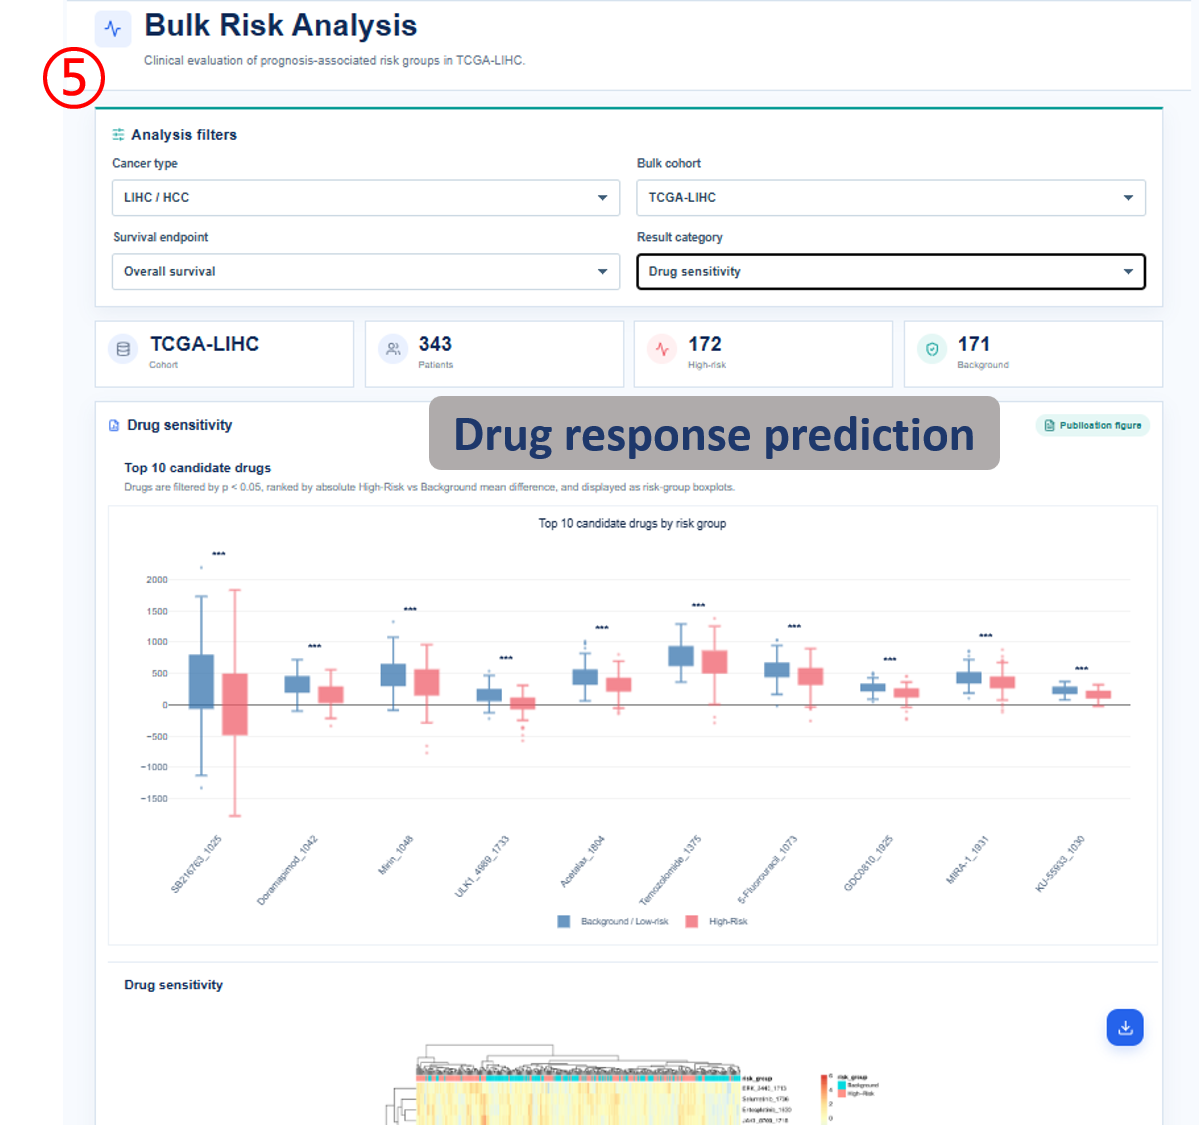
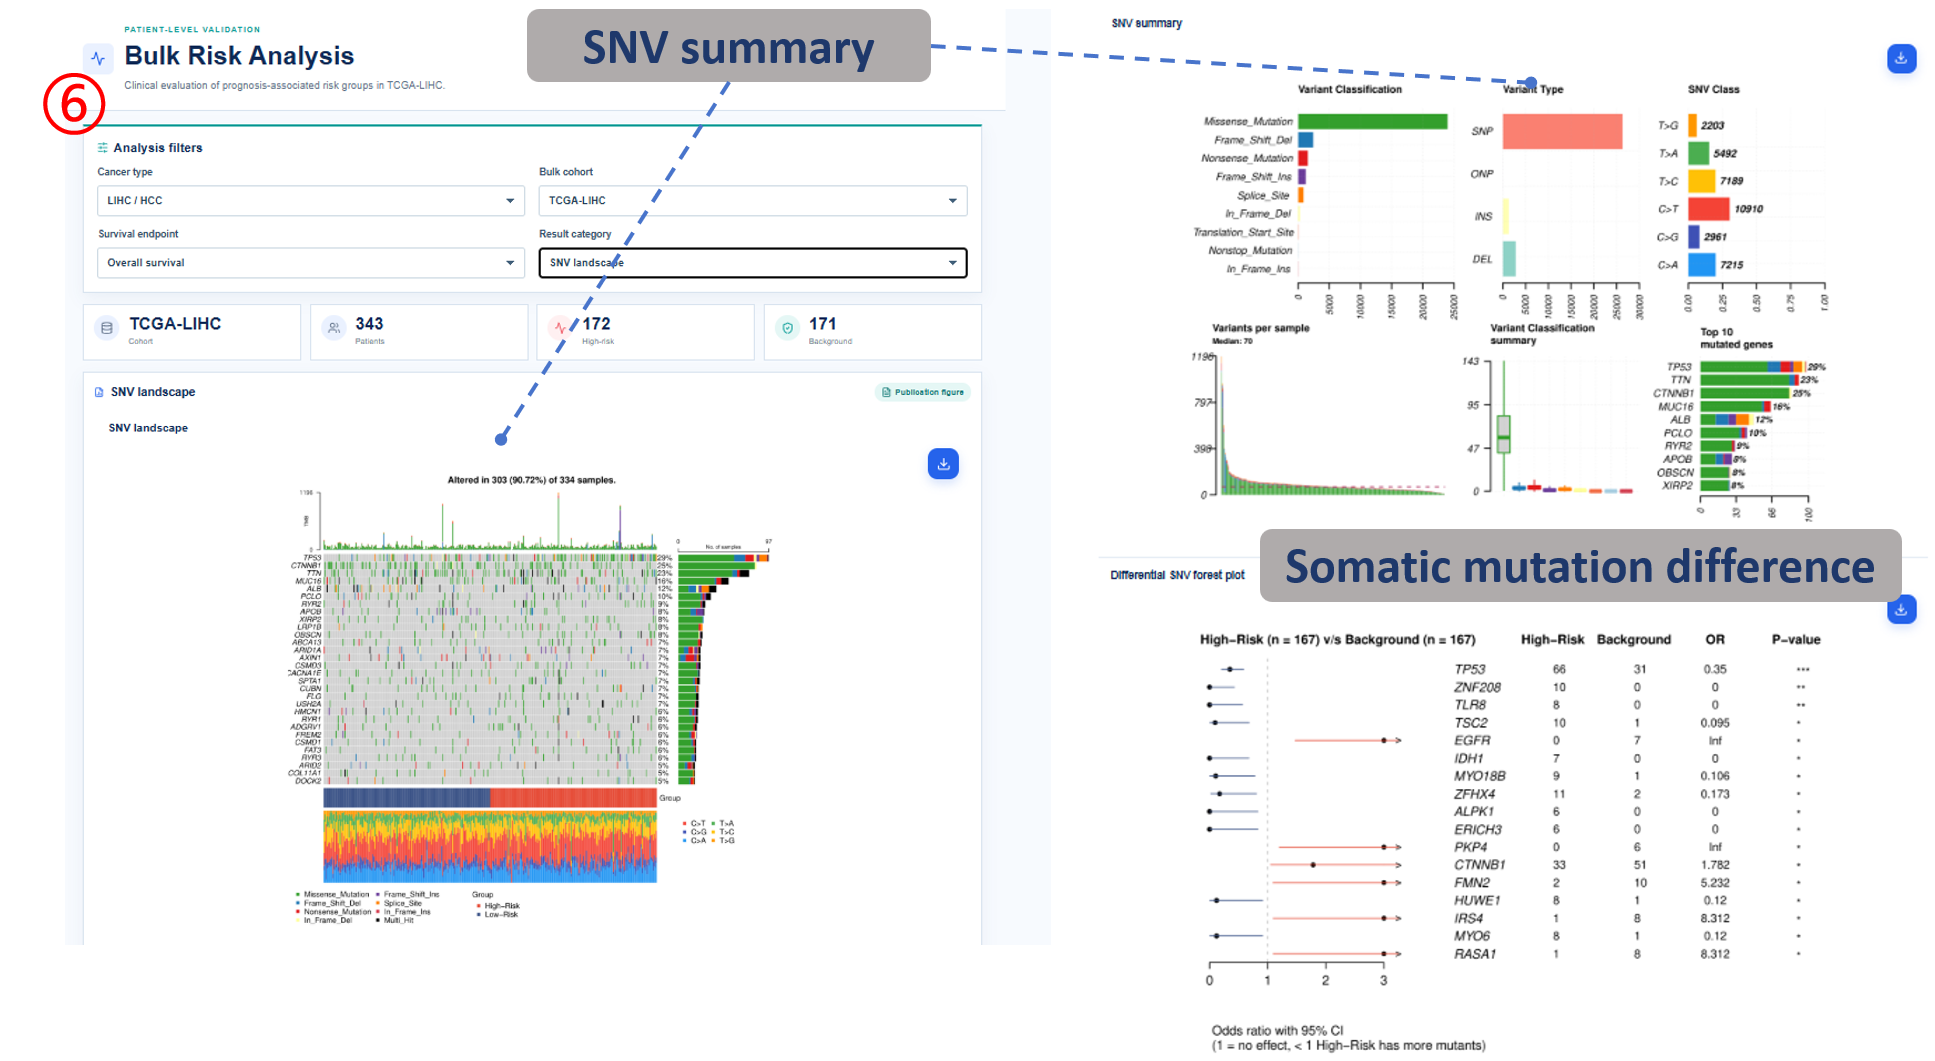
Analysis filters define cancer type, cohort, survival endpoint and result category before figures and tables are refreshed. Publication figure displays the curated SOP output for the selected analysis category, and Result table provides the numerical values behind each figure with pagination or download access when available. Survival analysis compares high-risk and background patient groups with Kaplan-Meier and Cox outputs. Differential signature shows genes altered between high-risk and background groups, or tumor and normal samples when available. The functional, clinical, immune, drug and SNV modules summarize downstream biological interpretation of the bulk risk groups.
Common table columns
- patient/sample identifiers: link each row to the indexed bulk cohort record.
- risk_group / risk_score: patient-level stratification used for survival and downstream comparisons.
- HR / CI / P value: hazard ratio, confidence interval and statistical significance for survival or Cox models.
- gene / log2FC / padj: differential-expression gene symbol, effect size and adjusted significance.
- term / pathway / gene_count: enrichment category, biological term and number of genes supporting the term.
- clinical variable / comparison: clinical covariate and group-level association being tested.
- TIDE / drug response / IC50: predicted immunotherapy or drug-sensitivity metrics by risk group.
- mutation gene / event / frequency: SNV-level gene, mutation event and group-specific mutation frequency.
Single-cell Risk Analysis
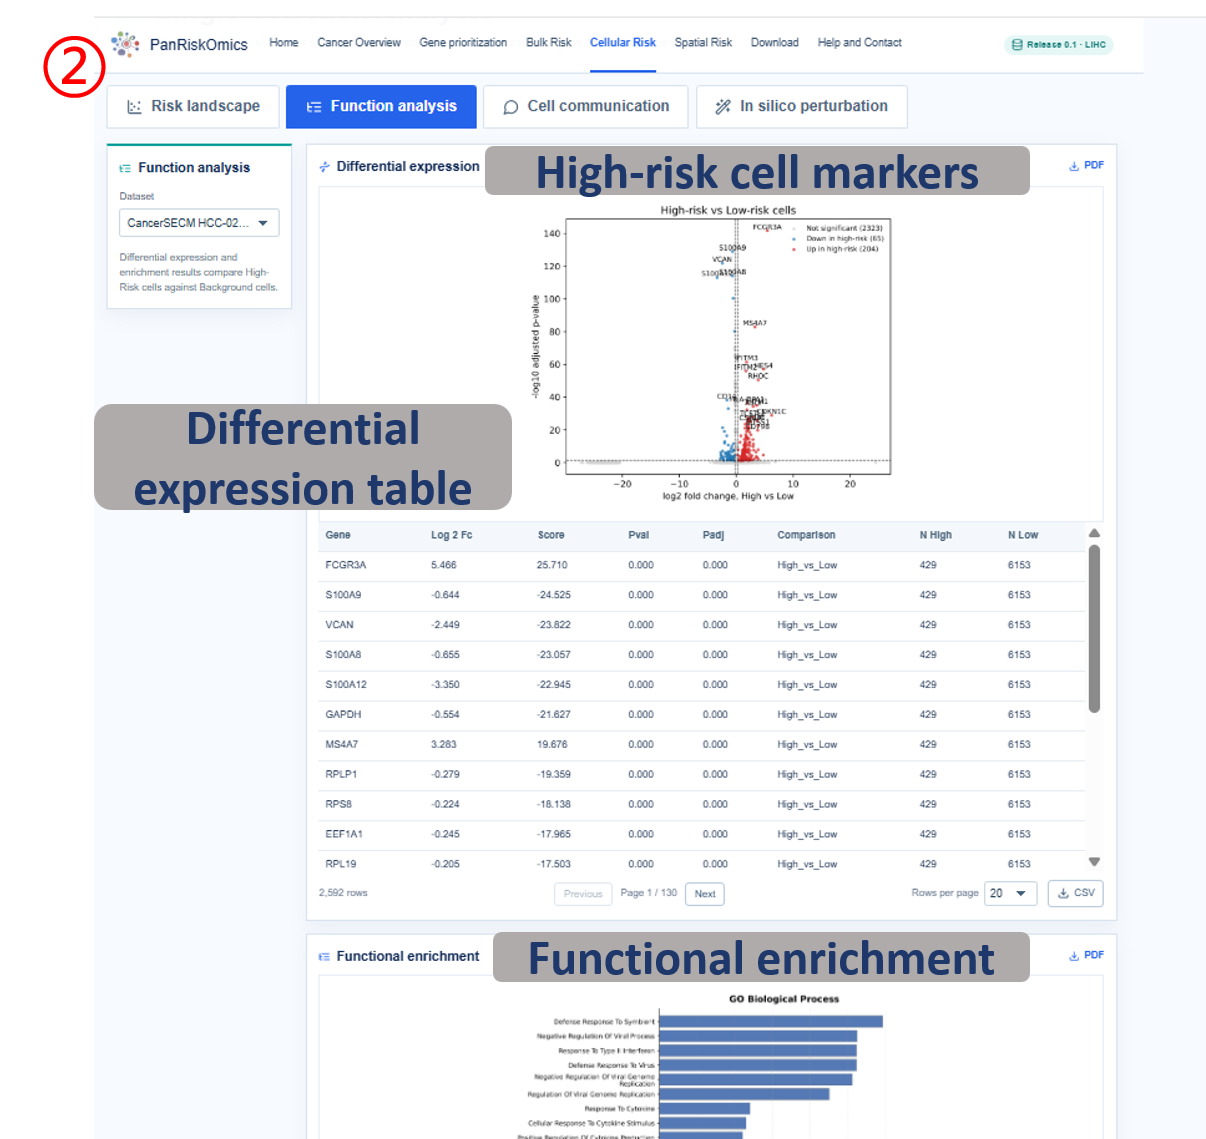
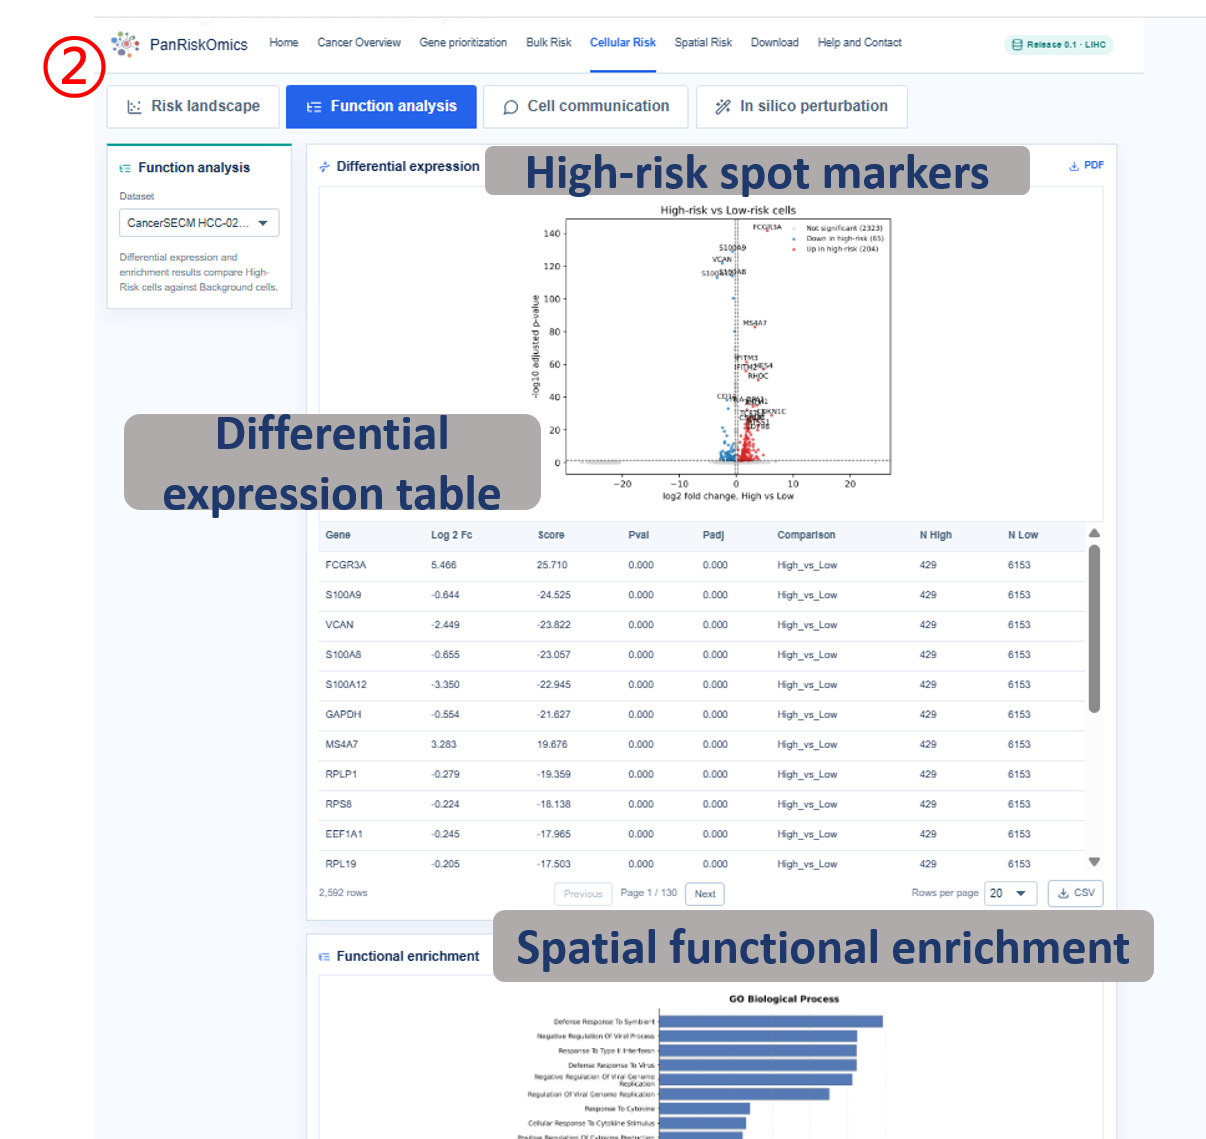
Annotated guide
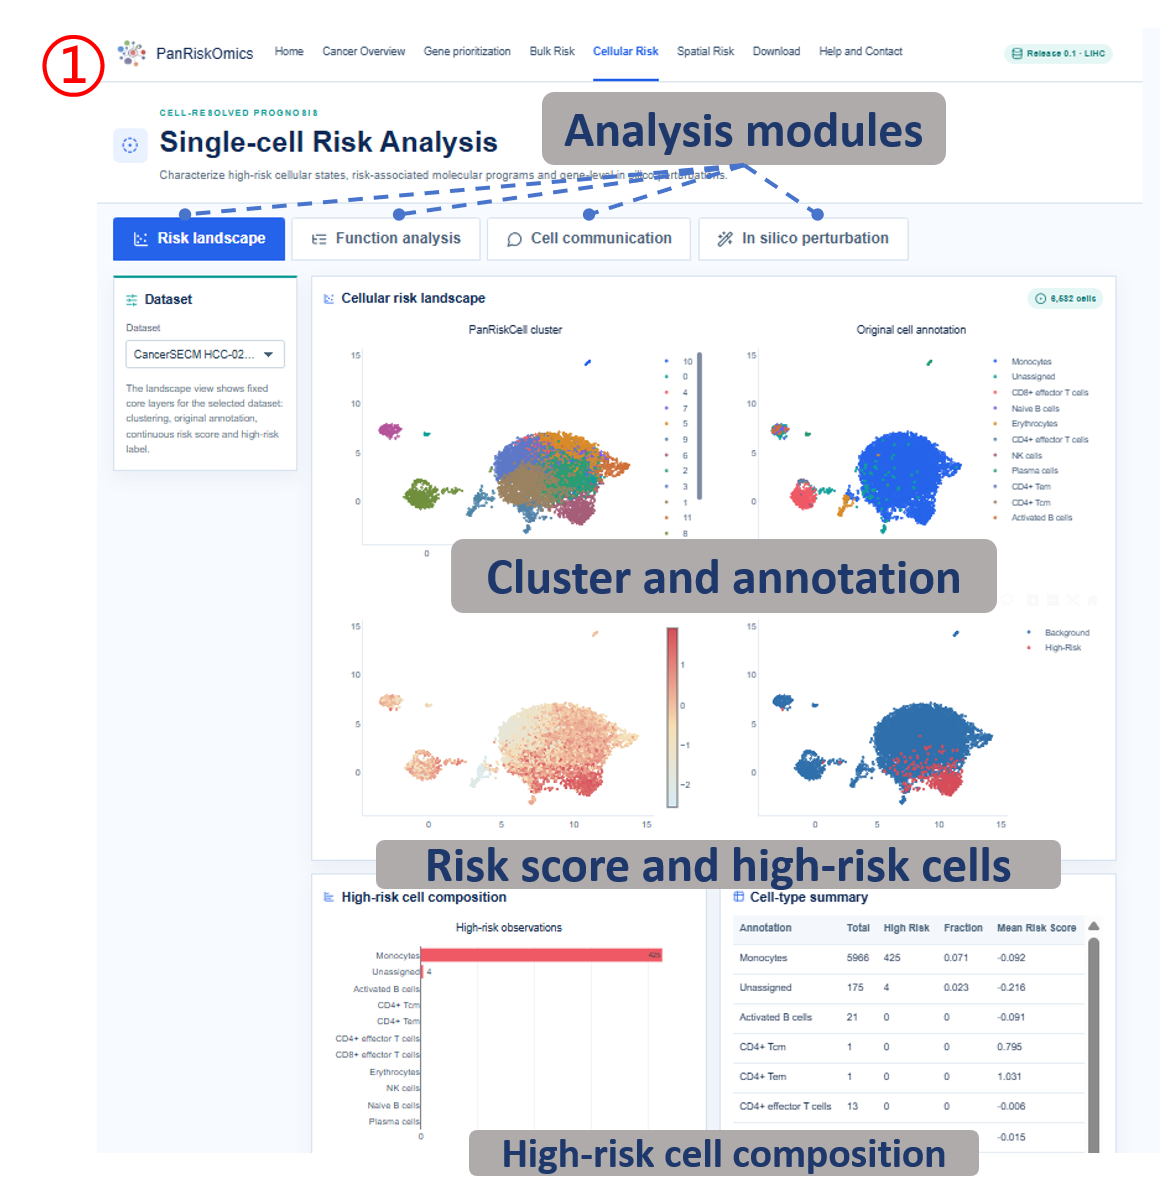
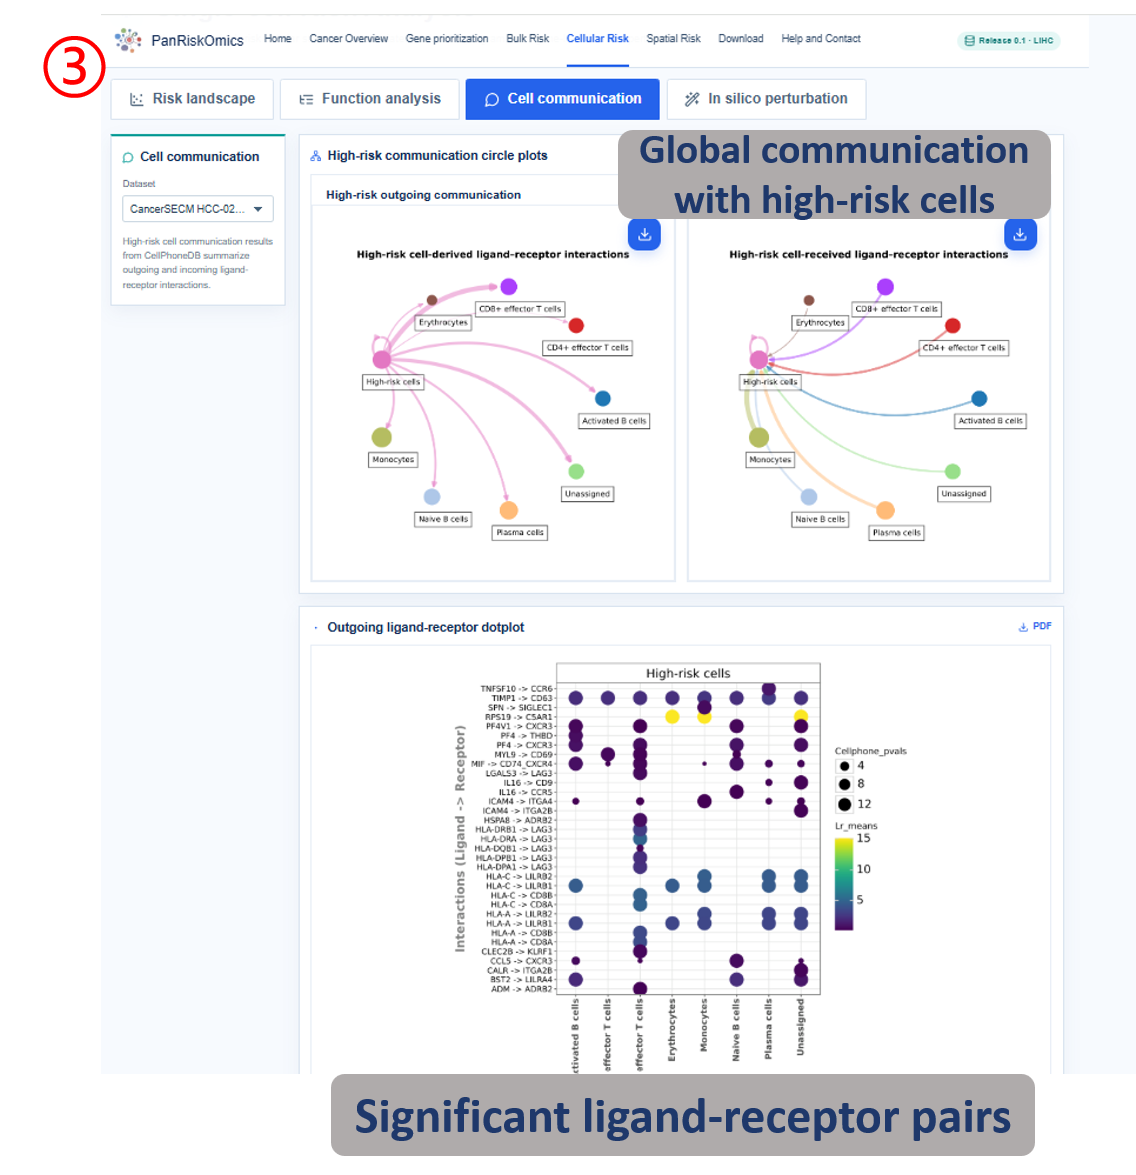
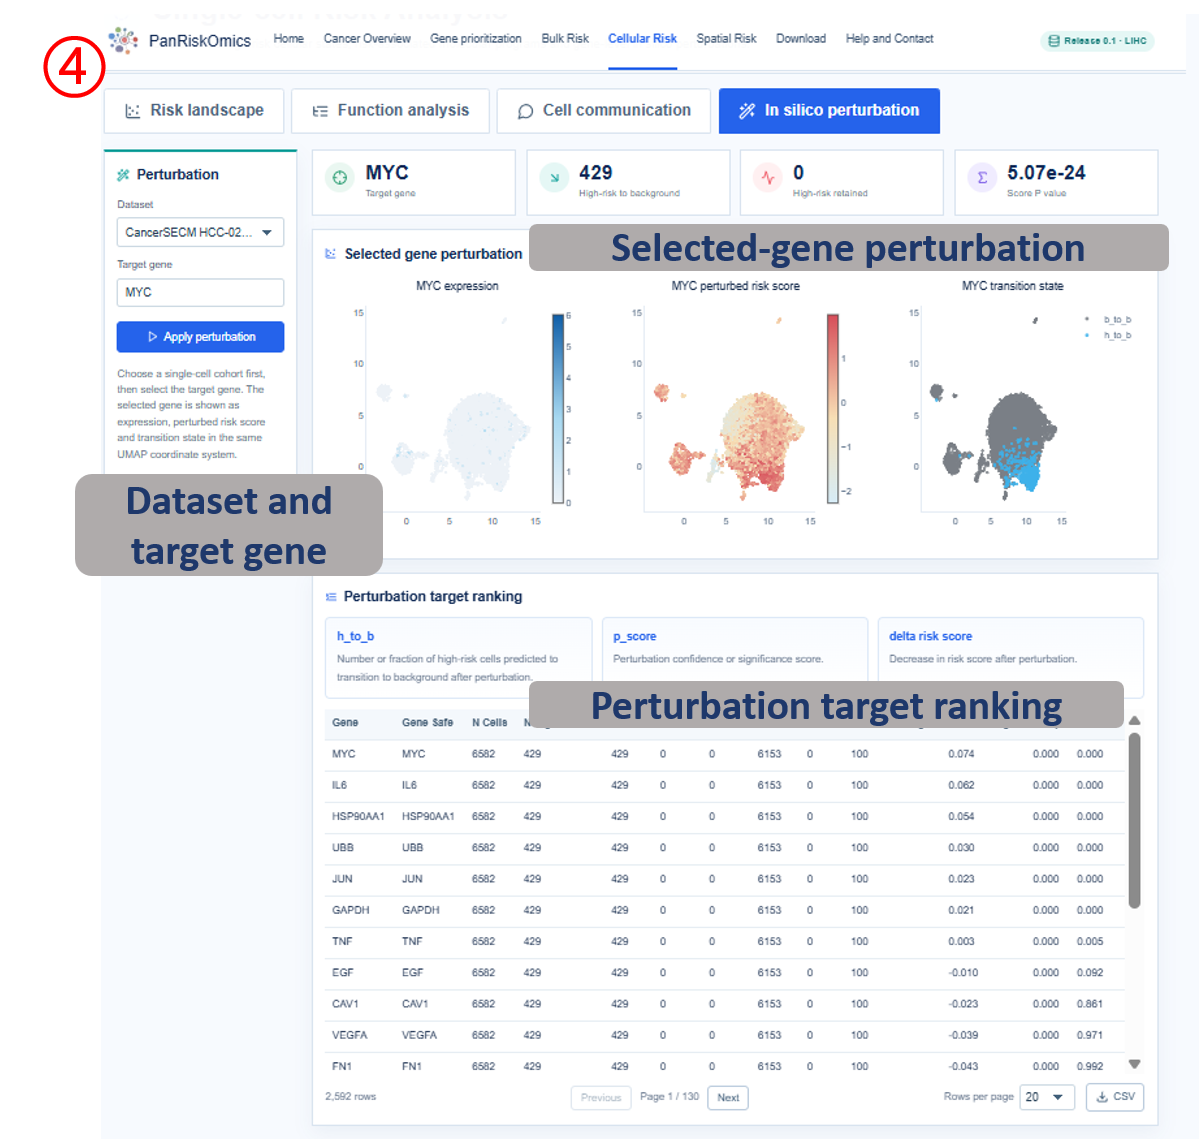
Dataset selector chooses the single-cell cohort used for all plots and tables. Risk landscape shows cluster, annotation, continuous risk score and high-risk label on the same UMAP layout. Composition panel summarizes which cell types contribute most to high-risk cellular states. Function analysis reports high-risk cell marker genes and enriched biological processes. Cell communication displays outgoing and incoming ligand-receptor interactions linked to high-risk cells. In silico perturbation compares original expression, perturbed risk score and transition state after target-gene perturbation.
Table columns
- annotation / celltype_major: curated cell-type label used for grouping cells.
- total: number of cells assigned to the cell type.
- high_risk: number of cells labeled as high-risk within the cell type.
- fraction: high-risk proportion within the cell type.
- mean_risk_score: average SIDISH risk value for the cell type.
- gene / avg_log2FC / p_val_adj: marker gene, expression effect size and adjusted significance in differential analysis.
- source / target / ligand / receptor: sending cell type, receiving cell type and ligand-receptor pair in communication tables.
- h_to_b / p_score / delta_risk_score: perturbation rescue count or fraction, confidence score and risk-score decrease.
Spatial Risk Analysis
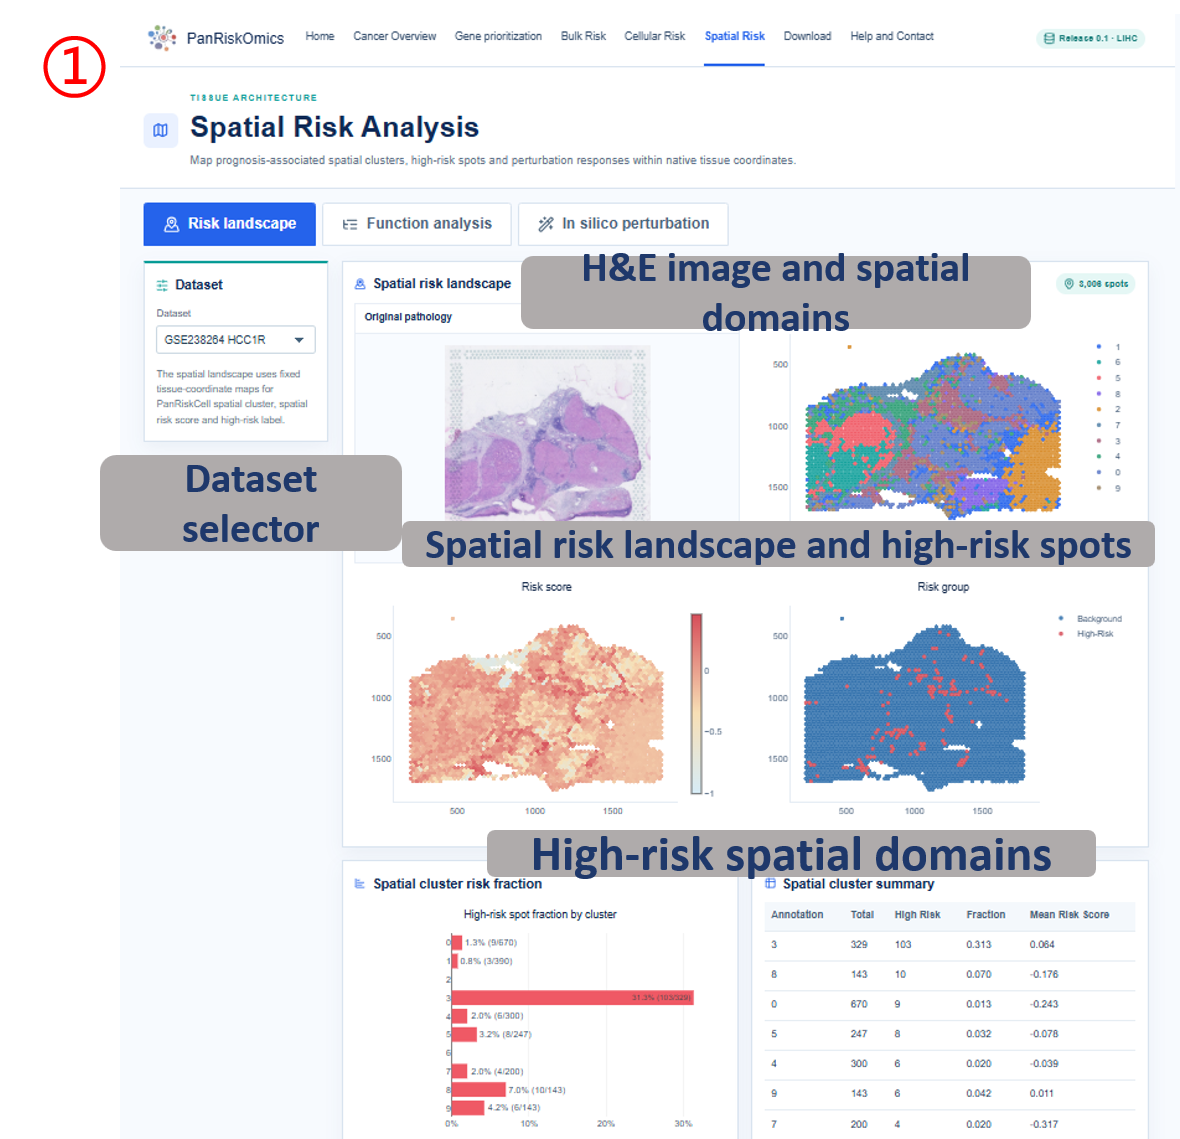
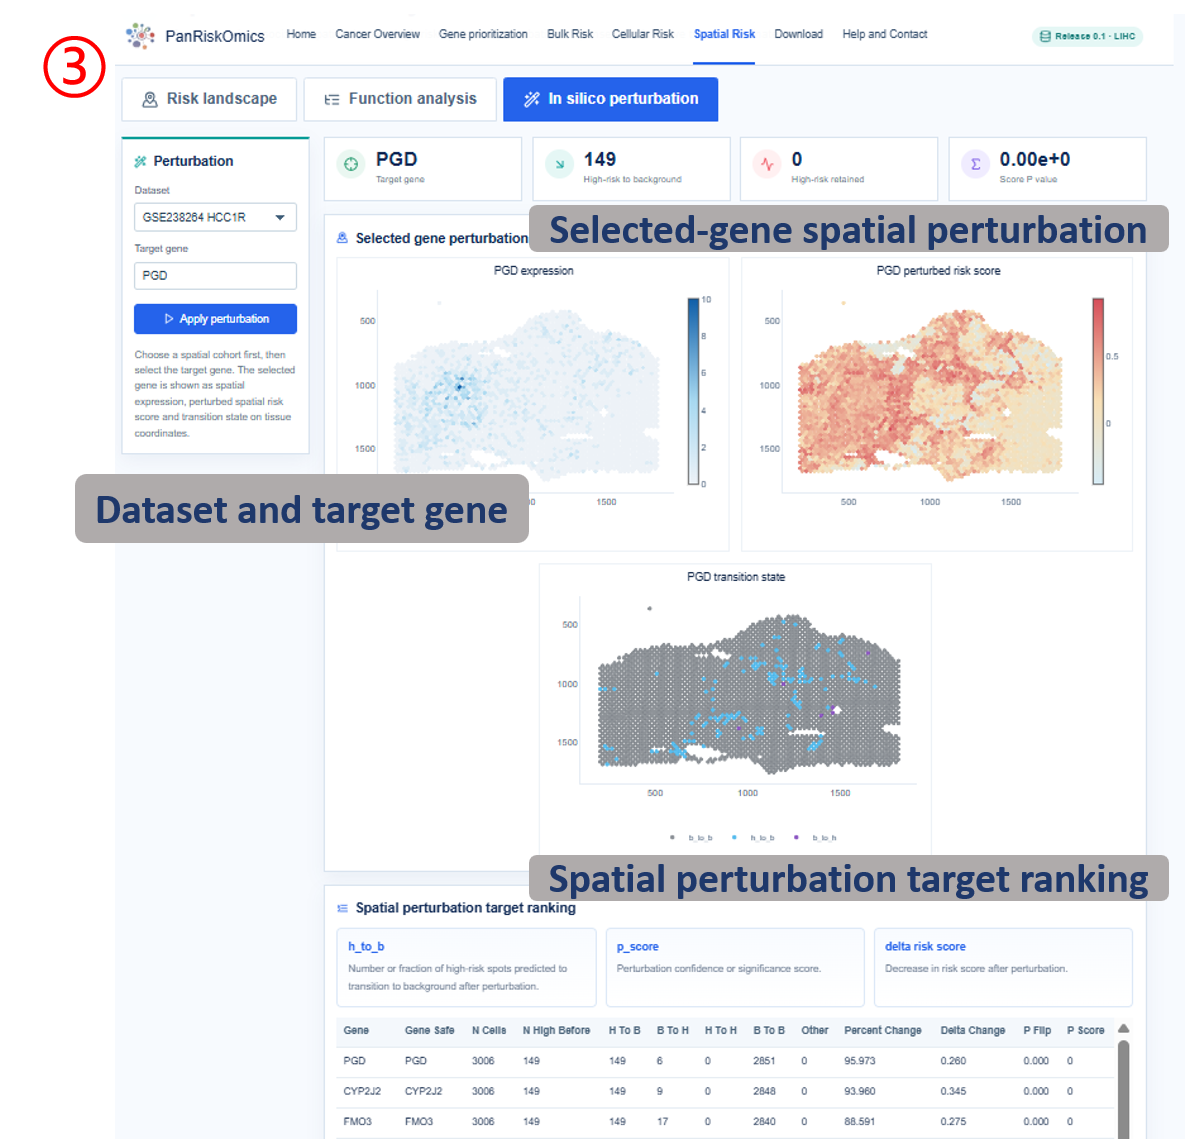
Annotated guide
Dataset selector chooses the spatial cohort and tissue section. Original pathology shows the H&E or tissue image used as spatial context. Spatial cluster map displays spot-level domain or cluster annotation. Spatial risk score maps continuous risk values back onto tissue coordinates. High-risk spots highlights spots labeled as high-risk by the transferred prognostic model. Perturbation maps show expression, perturbed spatial risk score and predicted transition state for the selected target gene.
Table columns
- annotation / spatial domain: spatial cluster or domain label used for grouping spots.
- total: number of spatial spots in the domain.
- high_risk: number of high-risk spots in the domain.
- fraction: high-risk proportion in the domain.
- mean_risk_score: average spot-level risk score for the domain.
- gene / logFC / adjusted P value: high-risk spot marker gene, effect size and multiple-testing corrected significance.
- GO term / gene count / FDR: enriched biological term, supporting genes and enrichment significance.
- h_to_b / p_score / transition: perturbation rescue summary and predicted spatial state transition category.
Download Center
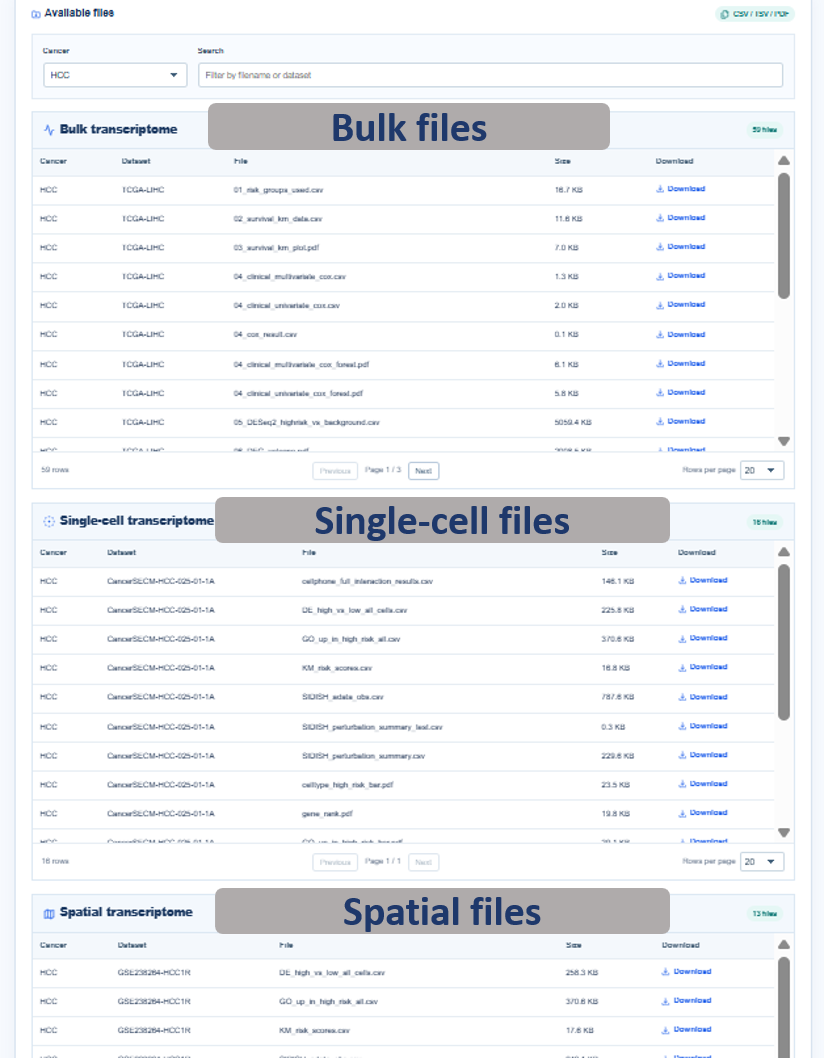
Annotated guide
Cancer filter narrows the download manifest to one cancer type. Search box filters files by dataset, modality or filename text. Bulk / Single-cell / Spatial sections separate downloadable assets by data layer. Download buttons retrieve curated CSV, TSV or PDF files while internal H5AD, pickle, model and notebook files remain unavailable.
Table columns
- cancer: cancer abbreviation associated with the downloadable asset.
- kind: data layer, such as bulk, single-cell or spatial.
- dataset_id: cohort or sample identifier used by the web application.
- filename: curated output file name exposed for download.
- size: file size used to estimate download scale.
- asset_id: internal download key combining layer, dataset and filename.
References
- Jolasun Y, Song K, Zheng Y, et al. SIDISH integrates single-cell and bulk transcriptomics to identify high-risk cells and guide precision therapeutics through in silico perturbation. Nature Communications. 2025;16:11271. doi:10.1038/s41467-025-66162-4.
- Liu J, Lichtenberg T, Hoadley KA, et al. An integrated TCGA pan-cancer clinical data resource to drive high-quality survival outcome analytics. Cell. 2018;173(2):400-416.e11.
- Edgar R, Domrachev M, Lash AE. Gene Expression Omnibus: NCBI gene expression and hybridization array data repository. Nucleic Acids Research. 2002;30(1):207-210.
- International Cancer Genome Consortium. International network of cancer genome projects. Nature. 2010;464:993-998.
- Zeng J, Nie Z, Shang Y, et al. CancerSCEM 2.0: an updated data resource of single-cell expression map across various human cancers. Nucleic Acids Research. 2025;53(D1):D1278-D1286. doi:10.1093/nar/gkae954.
- Zhou W, Su M, Jiang T, et al. SORC: an integrated spatial omics resource in cancer. Nucleic Acids Research. 2024;52(D1):D1429-D1437. doi:10.1093/nar/gkad820.
- Katzman JL, Shaham U, Cloninger A, Bates J, Jiang T, Kluger Y. DeepSurv: personalized treatment recommender system using a Cox proportional hazards deep neural network. BMC Medical Research Methodology. 2018;18:24.
- Love MI, Huber W, Anders S. Moderated estimation of fold change and dispersion for RNA-seq data with DESeq2. Genome Biology. 2014;15:550.
- Yu G, Wang LG, Han Y, He QY. clusterProfiler: an R package for comparing biological themes among gene clusters. OMICS. 2012;16(5):284-287.
- Yoshihara K, Shahmoradgoli M, Martinez E, et al. Inferring tumour purity and stromal and immune cell admixture from expression data. Nature Communications. 2013;4:2612.
- Jiang P, Gu S, Pan D, et al. Signatures of T cell dysfunction and exclusion predict cancer immunotherapy response. Nature Medicine. 2018;24:1550-1558.
- Efremova M, Vento-Tormo M, Teichmann SA, Vento-Tormo R. CellPhoneDB: inferring cell-cell communication from combined expression of multi-subunit ligand-receptor complexes. Nature Protocols. 2020;15:1484-1506.
- Wolf FA, Angerer P, Theis FJ. SCANPY: large-scale single-cell gene expression data analysis. Genome Biology. 2018;19:15.
Contact
Defu Liu 1#
Email: ningyan1212@gmail.com
Prof. Jing-wen Lin 1*
Email: lin.jingwen@scu.edu.cn
Prof. Lu Chen 1*
Email: luchen@scu.edu.cn
Affiliation
1 Department of Laboratory Medicine, Key Laboratory of Birth Defects and Related Diseases of Women and Children of MOE, State Key Laboratory of Biotherapy, West China Second Hospital, Sichuan University, Chengdu 610041, China